FIGURE 1. Multidimensional model illustration
Postsecondary Inuit StudentS from Nunavut Pathways: When Students’ Satisfaction Meets Language Discrimination
THIERRY RODON Université Laval
JEAN-LUC RATEL Université du Québec à Montréal
PAMELA HAKONGAK GROSS Nunavut Government
FRANCIS LÉVESQUE Université du Québec en Abitibi-Témiscamingue
MAATALII OKALIK Ilisimatusarfik Kalaallit Nunaat
Nunavut was created to allow Inuit to regain control of their homeland and to ensure that Inuit culture and values would be protected and enhanced, a goal which can best be achieved through an Inuit workforce. In keeping with this objective, Article 23 of the Nunavut Land Claims Agreement calls for a workforce reflective of the population of Inuit in Nunavut at all levels of government in the territory. However, with only 50% of Nunavut government employees being Inuit (Government of Nunavut, 2020) and only 40% representation at the federal government level (Murray, 2019), this is far from being the reality. This goal has only been reached at the municipal level, where 85% of employees are Inuit (Murray, 2019). There is therefore a strong need for Inuit with postsecondary education in order to increase the percentage of Inuit employed by the government.
The purpose of our article is to present an analysis of data collected during a survey on the educational and professional success of Nunavut Inuit who were attending or had attended postsecondary programs1 at college2 or university in Nunavut and/or outside Nunavut, a topic that has not been studied so far. Specifically, the survey sought to: a) collect data on postsecondary educational success among Inuit students within and outside Nunavut; and b) collect data on professional success among Inuit with a postsecondary education, depending on whether they graduated or not.
We present a bivariate and multivariate analysis of this data to answer the following questions:
What is the relationship between educational success and professional success amongst Inuit of Nunavut who have undertaken a postsecondary program?
Are there specific trends among these Inuit students that differ from the rest of Canadians?
What are the main factors that affect Inuit postsecondary student pathways and professional experiences?
Understanding these pathways would allow us to ascertain how postsecondary education can contribute to the social and political development of the territory.
1. Education in Nunavut
Between 1945 and 1970, schools in the Eastern Arctic were developed in a colonial context, in a period when Inuit were losing control of their homeland. With the transfer of administrative responsibility from federal to the Northwest Territories (NWT) authorities in 1970, the Eastern Arctic Inuit gradually began to regain control over their own education, notably with the integration of their languages and cultures into classrooms. From 1982 to 1999, responsibility for education was partly delegated to the local level. Then, with the creation of Nunavut in 1999, a Department of Education specific to the new territory was established (McGregor, 2010). In spite of this, many concerns remain about developing a culturally relevant curriculum for Nunavut Inuit in a context where the high school dropout rate remains high. Berger (2009) and Skutnabb-Kangas et al. (2019) have also noted that English is privileged over Inuit languages at school, causing systemic discrimination3 against students who are not fluent in the dominant language.
The idea of creating a university in the Northern Canadian territories has been around since 1964 but has only been discussed more seriously in recent years (Graham, 2015). Nunavut Arctic College was established in 1995. Originally founded in 1968 as the Adult Vocational Training Centre and renamed Arctic College in 1982, it offers vocational, adult education, and postsecondary programs throughout Nunavut (Rodon et al., 2018a). The typical Nunavut Arctic College student is a mother between 30 to 40 years old who is pursuing a postsecondary education without having earned a high school diploma (Gaviria, 2013). Gaviria has also noted that even if Nunavut Arctic College is present in each community, the number of programs actually available is small, especially at the postsecondary level.
Some programs are offered locally in collaboration with universities and colleges from outside Nunavut, but most students must leave the territory to pursue postsecondary education (Rodon et al., 2015; Rodon et al., 2018b). Student funding comes primarily from territorial (FANS) and regional (Inuit organizations) sources (Rodon et al., 2018b). Despite research showing that students are generally satisfied with their educational experience (Rodon et al., 2015), the lack of locally available programs is still a negative factor affecting prospective postsecondary students. This limited availability of postsecondary options can be attributed to the colonial context in which higher education evolved in Northern Canadian territories (Black, 2015) such that Inuit who want to pursue a postsecondary education face challenges largely unknown to other postsecondary students from Southern Canada (Rodon et al., 2015). For example, the majority must move away from home, remove themselves from their network, and live in locations that are foreign to them. This unique and challenging context engenders a need for better understanding as to how better postsecondary education opportunities can contribute to the social, political, and economic development of the territory.
2. Methodology
Data was collected through a 70-question survey completed by 362 Inuit participants throughout Nunavut, 66.2% of whom were women (239 out of 3614) and 33.8% were men (122 out of 361). Questions covered education history (K–12), postsecondary experience, job experience, and sociodemographic information. All participants had studied, or were studying, at a postsecondary institution in Nunavut (Nunavut Arctic College) or outside of the territory (mostly in Ontario and Manitoba) and had college and university experience. According to the National Household Survey Aboriginal Population Profile for 2011 (Statistics Canada, 2013), 61.7% of the 2,230 Nunavut Inuit with college or university degrees or certificates are women; this would indicate that our sample closely resembled the surveyed population. All participants were aged between 17 and 63, the median age being 31 years old; 49.2% were born in the Qikiqtaaluk region (177 out of 360), 37.5% in the Kivalliq region (135 out of 360), 8.9% in the Kitikmeot region (32 out of 360), and 4.4% outside of Nunavut (16 out of 360).
The survey was first tested in March 2012 with Nunavut Sivuniksavut students,5 who gave useful feedback to the research team. Funding was then secured from the Nunavut General Monitoring Plan. From September 2012 to January 2013, 70 surveys were administered using a snowball methodology. Preliminary results were presented to Nunavut stakeholders in Iqaluit in March 2013. Among them were representatives from Nunavut Arctic College, the Coalition of Nunavut District Education Authorities, Nunavut Tungavik Inc., the Government of Nunavut, Inuit Tapiriit Kanatami, the Nunavut Research Institute, and the Nunavut General Monitoring Plan. Stakeholders validated the data, provided useful feedback, and encouraged the team to administer more surveys to gain a better idea of the situation. Following this meeting, additional funding was secured from the Nunavut General Monitoring Plan, and this time, two Inuit regional coordinators were also hired to tour Nunavut communities in order to administer surveys, meet local authorities, and hire and train local researchers. In the summer of 2013, the Qiqiktani coordinator, Maatalii Okalik, visited Iqaluit, Kimmirut, Qikiqtarjuaq, Iglulik, and Pond Inlet, while the Kivalliq and Kitikmeot coordinator, Pamela Gross, visited Cambridge Bay, Arviat, Rankin Inlet, Baker Lake, and Kugluktuk. They hired local surveyors in each community. Using the snowball method, they administered 292 surveys, bringing the total to 362. Preliminary results were presented to many of the same stakeholders at a final meeting held in Iqaluit in February 2014. Again, this meeting was an opportunity for the team to validate the data and obtain additional feedback. A preliminary 57-page report was subsequently made available to all stakeholders for comments, generating further feedback useful for interpreting the data.
Surveys were administered with iPads using an app designed to facilitate survey administration. The app was chosen because it could be used offline, an important feature in the many Nunavut communities where Wi-Fi is not widely available. Once surveys were completed, coordinators synchronized them with a centralized database hosted by the app. The decision to hire regional coordinators and local researchers proved fruitful, as it allowed us to obtain a high number of participants. Having Inuit become involved in the project, both as coordinators and as local researchers, also improved the quality of the relationship between the research team and the communities. Local authorities were extremely open to providing researchers and coordinators with office space, airtime on community radio to introduce the project, and so forth. We did have minor technological issues at times, and high turnover of local researchers in some communities, but the project generally ran smoothly.
For the analysis, we used a bivariate analysis, crossing survey responses by language, region, and gender. These results are presented in the “Main Influences” section of this paper. Additionally, given our interest in the relationship between factors related to appreciation of the postsecondary experience and satisfaction at work,6 we chose a method that focuses on associations between the answers given by participants: multiple correspondence analysis (MCA). This method was initially developed by Benzécri et al. (1973) and has been internationally recognized since the 1980s (Le Roux & Rouanet, 2010).
Through our MCA model, we identified a total of six variables (language, home region in Nunavut, gender, parents’ educational attainment, satisfaction at work, and appreciation of the postsecondary experience). We had to rely on multiple imputation using the fully conditional specification method (FCS) (van Buuren, 2007). This operation allowed us to replace missing data with imputed data based on the answers given by participants.7 These results are presented in the “Multidimensional Model of Educational and Professional Pathways” section of this article.
3. Sample characteristics
Our sample was composed of a total of 362 participants from Nunavut who attended a postsecondary program. All participants were aged between 17 and 63, the median age being 31 years old. The survey sample represented about 16.2% of Nunavut Inuit with postsecondary experience at college or university, based on a population of 2,230 Inuit aged 15 years and older with a “College, CEGEP or other non-university certificate or diploma,” “University certificate or diploma below bachelor level,” or “University certificate, diploma or degree at bachelor level or above” (Statistics Canada, 2013).8
3.1 Geographic Profile
About half of the participants (49.2% or 177 out of 360) were born in the Qikiqtaaluk region, 37.5% in the Kivalliq region (135 out of 360), 8.9% in the Kitikmeot region (32 out of 360), and 4.4% outside of Nunavut (16 out of 360). According to the 2011 NHS Aboriginal Population Profile (Statistics Canada, 2013),9 our sample is close to the proportion of Inuit aged 15 years and over with college or university diplomas or certificates living in Qikiqtaaluk (56.9%). However, our sample overrepresented Inuit from Kivalliq (25.9%) and underrepresented Inuit from Kitikmeot (17.2%). Most participants (83.4% or 286 out of 343) had attended high school in Nunavut: 47.2% in Qikiqtaaluk, 29.4% in Kivalliq, and 6.7% in Kitikmeot.10 One year prior to starting postsecondary education, most participants (84.7% or 298 out of 352) had also been living in Nunavut: 44.0% in Qikiqtaaluk, 32.1% in Kivalliq, and 8.5% in Kitikmeot.
Most participants saw the postsecondary experience as a way to develop new skills that would be useful in their home communities. About two thirds of them (67.1% or 232 out of 346) were living in the communities where they were born. The most important reasons keeping them there were to be with family members and spouses (85.8% or 205 out of 239) and because it was where their work was situated (57.1% or 137 out of 240). Of the 32.9% of participants (114 out of 346) living outside of their home communities, most said it was because they had either wanted to move (27.9% or 43 out of 154) or pursue an education (27.3% or 42 out of 154).
Most of the participants (54.7% or 197 out of 360) were working in their home communities at the time of the survey. Among those who were not, 61.4% (97 out of 158) would have liked to have been, had they had the opportunity to do so. Interestingly, 67.9% (133 out of 196) of participants working in their home communities also said they were prepared to move to improve their job or career opportunities. Thus, although home communities seem to occupy an important place for most participants, a large majority of participants would have nevertheless agreed to move to improve their career prospects.
3.2 Educational Background
A substantial majority of the participants (74.6% or 249 out of 334) had a high school diploma, having graduated from Grade 12 (68.0% or 227 out of 334) or completed a Nunavut High School Equivalency Diploma (6.6% or 22 out of 334). This proportion is much higher than it is for Nunavut Inuit in general (33.3%). A majority (60.2% or 215 out of 357) of participants had never repeated a grade in school, 29.7% had repeated once (106 out of 357), and 10.1% had repeated twice or more (36 out of 357). Data also showed that survey participants had higher educational attainment than their parents: in 22.6% of cases (74 out of 328), neither parent had completed elementary school (Grade 6); in 43.3% of cases (142 out of 328), neither parent had completed high school (Grade 12); in 32.0% of cases (105 out of 328) at least one parent had completed high school; and in 24.7% of cases (81 out of 328) at least one parent had a postsecondary education. Even so, educational attainment was higher among the participants’ parents than among the overall Nunavut Inuit population. According to the 2011 NHS Aboriginal Population Profile (Statistics Canada, 2013), 66.7% of those aged 15 and older have no certificate, diploma, or degree; 12.6% have a high school diploma as their highest diploma; and 20.6% have a postsecondary certificate, diploma, or degree (including 7.8% with apprenticeship or a trades certificate or diploma). Therefore, although participants’ parents had less postsecondary education than the general population in Nunavut, more of them had graduated from high school.
3.3 Postsecondary Experience
Most participants had undertaken two postsecondary programs or more (58.0% or 202 out of 348). Only 1.8% (6 out of 327) had not completed a postsecondary program and 41.0% had completed two or more programs (134 out of 327). The most frequent reasons invoked for quitting a program were lack of interest or motivation (45 answers), financial reasons (36 answers), family responsibilities11 (33 answers), homesickness (31 answers), job opportunities (26 answers), lack of support (24 answers), bad results (23 answers), or being pregnant or having to take care of children (22 answers).
In order to improve their postsecondary experience, participants mentioned the need to improve access to daycare (65.8% or 208 out of 316), increase and adapt funding (57.6% or 182 out of 316), and improve the availability of housing for families (23.4% or 74 out of 316). The vast majority (81.6% or 284 out of 348) said they wanted to go back to school to pursue other postsecondary programs. Participants showed high academic satisfaction with their postsecondary experiences:12 22.0% were very satisfied (54 out of 246), 76.4% were satisfied (188 out of 246), and only 1.6% were dissatisfied (4 out of 246).
In terms of financial support, Inuit postsecondary students from Nunavut have access to various options to cover the cost of postsecondary education. The Nunavut government provides assistance through FANS (Financial Assistance for Nunavut Students), which requires that students take a full course load and work toward a diploma, certificate, or degree. Some students also have access to funds through their regional Inuit organization. Many also have parents helping them while some pay certain expenses by working.
In short, survey participants had access to a variety of funding sources to pay for their postsecondary education. About half received a grant, bursary, or scholarship funding (53.4% or 187 out of 350), and 32.8% (115 out of 351) received funding through their regional Inuit organization. The vast majority (74.6% or 197 out of 264) received funding through FANS, followed by Inuit organizations (9.1% or 24 out of 264), Kakivak13 (8.0% or 21 out of 264), or other sources (8.3% or 22 out of 264). Another 23.4% (82 out of 351) worked and used their own savings, 16.8% (59 out of 352) received loans from their parents they did not have to pay back, and 4.1% (12 out of 294) received a bank loan or a line of credit. Nevertheless, only 32.5% of participants (111 out of 342) felt that the money they had was sufficient for their needs: 24.0% (82 out of 342) said it was not sufficient, and 43.6% (149 out of 342) said it was barely sufficient.
3.4 Professional Experience
About half of the participants (46.7% or 43 out of 92) agreed with the statement that they were working in a field related to their postsecondary education, whereas 28.3% disagreed (26 out of 92) and 25.0% neither agreed nor disagreed (23 out of 92). This suggests the desire for a strong link between postsecondary education and the type of job participants held, but it was impossible to know if those who were not working in a related field had been unable to find such work or had moved on to another job after having worked in a field related to their education.14 We do know, however, that 76.2% of participants (256 out of 336) were employed when they answered the survey (68.2% full time and 8.0% part time), and that only 9.2% (31 out of 336) were looking for work. Another 7.4% (25 out of 336) were at school, 3.3% (11 out of 336) were at home, 0.9% (3 out of 336) were engaged in subsistence activities, and 3.0% (10 out of 336) reported a combination of the above. When compared to data from the 2011 NHS Aboriginal Population Profile (Statistics Canada, 2013), participants had a much better work situation than the general Nunavut Inuit population,15 in which 43.7% of people aged 15 and over were employed, 13.3% were unemployed, and 43.0% were not active in the labour force. This indicates that pursuing postsecondary education increases one’s chances of being employed and being part of the labour force.
The vast majority of participants (79.4% or 282 out of 355) had jobs before pursuing postsecondary education, mostly in administrative support (32.5% or 89 out of 274) and retail (27.0% or 74 out of 274). More than one third (39.4% or 108 out of 274) held jobs that required postsecondary education (executive, management, professional, and paraprofessional positions). Data thus showed that job status increased with postsecondary education. Indeed, the number of participants holding jobs at the lower end of the spectrum decreased. For example, the number of participants working in retail dropped from 27.0% to 3.4% (8 out of 234). This drop can be explained by two factors: a) postsecondary education gives participants the capacity to work in better jobs; and b) participants, many of whom had held retail jobs while in high school or while pursuing postsecondary education, were old enough to move away after completing their studies. The number of participants working in administrative support also decreased from 32.5% to 28.6% (67 out of 234), whereas the number of professionals increased from 14.6% to 23.9% (56 out of 234). The number of middle managers doubled (from 8.4% to 15.8% or 37 out of 234) and the number of senior managers increased six times (from 1.8% to 10.7% or 25 out of 234).16
Overall, the vast majority of participants were satisfied (58.6% or 163 out of 278) or very satisfied (34.9% or 97 out of 278) with their jobs.17 Only 4.7% were dissatisfied (13 out of 278) and 1.8% strongly dissatisfied (5 out of 278).
4. Main influences (bivariate analysis)
Bivariate analysis consists of measuring the effect of one variable on another to determine if there is a significant association. In this section, we identify the main associations concerning postsecondary students’ pathways and professional experiences. The degree of significance is measured using the Pearson chi-squared test, which evaluates whether a difference between the results observed and a null hypothesis (i.e., a hypothesis that postulates no difference between two variables) is due to chance. The data presented in this section are for results that successfully passed the Pearson chi-squared test at 0.05 or less (asymptotic significance, 2-sided).18 Results that passed at a slightly lower quality level are mentioned in a footnote. We identified three main influences on postsecondary students’ pathways and professional experiences: main language spoken at home, region where they were living 12 months before entering postsecondary education, and gender.
4.1 Language
Approximately the same proportion of participants mainly used English (44.2% or 159 out of 360) or an Inuit language (43.3% or 156 out of 360) at home, and 12.2% used both (44 out of 360).19 The 2011 NHS Aboriginal Population Profile (Statistics Canada, 2013) indicates that 60.7% of Nunavut Inuit most often speak an Inuit language at home, which means that the survey participants were less likely to speak an Inuit language at home than Nunavut Inuit in general. Furthermore, 89.2% of all participants (322 out of 361) said they were fluent in English and 74.0% in an Inuit language (267 out of 361).
As Table 1 shows, language is a major factor impacting postsecondary education for Nunavut Inuit. As we can see, participants from Qikiqtaaluk20 (56.9% or 87 out of 153) and Kivalliq (46.9% or 53 out of 113) were more likely to speak an Inuit language at home than those from Kitikmeot (3.3% or 1 out of 30) and outside (24.1% or 13 out of 54). Conversely, English was more widely used at home in Kitikmeot (93.3% or 28 out of 30) and outside (72.2% or 39 out 54), followed by Kivalliq (38.9% or 44 out of 113) and Qikiqtaaluk (26.8% or 41 out of 153). Combined use of Inuit and English at home was more frequent among participants from Qikiqtaaluk (15.7% or 24 out of 153) and Kivalliq (14.2% or 16 out of 113) but represented only 3.3% of those from Kitikmeot (1 out of 30) and 3.7% of those from Nunavut (2 out of 54).
TABLE 1. Main influence: Language spoken at home
|
Inuit Language |
English |
Both Inuit and English |
Region of residency 1 year before postsecondary |
More prevalent in Qikiqtaaluk (56.9%) and Kivalliq (46.9%) |
More prevalent in Kitikmeot (93.3%) and outside Nunavut (72.2%) |
More frequent in Qikiqtaaluk (15.7%) and Kivalliq (14.2%) |
Parents’ educational attainment |
26.3% with Grade 12 10.9% with postsecondary education |
40.9% with Grade 12 37.0% with postsecondary education |
14.7% with Grade 12 23.5% with postsecondary education |
Having a room to do homework (high school) |
83.8% |
92.9% |
69.00% |
Grade repeated (high school) |
44.1% |
32.9% |
47.7% |
Graduation (high school) |
67.1% |
87.6% |
60.5% |
Age of entry (postsecondary) |
24.76 years old (mean) |
21.35 years old (mean) |
23.69 years old (mean) |
Received grants, bursaries, or scholarships (postsecondary) |
47.4% |
63.8% |
38.6% |
Academic satisfaction (postsecondary) |
13.0% strongly satisfied 83.7% satisfied |
28.8% strongly satisfied 70.3% satisfied |
23.5% strongly satisfied 76.5% satisfied |
Participants who mainly used English at home were a little more likely to have had access to a room to do their homework (92.9% or 91 out of 98) than those who mainly used an Inuit language (83.8% or 109 out of 130) or both languages (69.0% or 29 out of 42). This means that they had better material conditions at home during high school, a factor we can link to the known effect of a good environment on homework completion (Xu & Wu, 2013). They were also more likely to have graduated from high school (87.6% or 120 out of 137) than those mainly using an Inuit language (67.1% or 102 out of 152) or both English and an Inuit language (60.5% or 26 out of 43). In addition, the proportion of students who repeated a grade21 was lower among participants who spoke mainly English at home (32.9% or 52 out of 158) compared to those who spoke mainly an Inuit language (44.1% or 67 out of 152) or who spoke both (47.7% or 21 out of 44). These same participants were also more likely to have parents with higher educational attainment:22 40.9% (63 out of 154) had parents who had completed Grade 12 or equivalent and 37.0% (57 out of 154) had parents with postsecondary experience. In comparison, 26.3% (36 out of 137) of those who mainly spoke an Inuit language at home had parents who had completed Grade 12 or equivalent, and 10.9% had parents with some postsecondary experience (15 out of 137). For those who spoke both languages at home, these numbers were respectively 14.7% (5 out of 34) and 23.5% (8 out of 34).
Survey participants who mainly spoke English at home tended to be a little younger in age (mean of 21.4 years old, n = 142) than those who mainly spoke an Inuit language (23.7 years old, n = 129) or both languages (24.8 years old, n = 37). They were also more likely (63.8% or 97 out of 152) to have received money from grants, bursaries, or scholarships (including from an Inuit organization) than those who mainly spoke an Inuit language (47.4% or 72 out of 152) or those who spoke both languages (38.6% or 17 out of 44).
We also observed that participants who mainly spoke English at home had higher academic satisfaction, with 28.8% (34 out of 118) strongly satisfied and 70.3% (83 out of 118) satisfied compared to 13.0% (12 out of 92) strongly satisfied and 83.7% (77 out of 92) satisfied for those who mainly spoke an Inuit language, and 23.5% (8 out of 34) strongly satisfied and 76.5% (26 out of 34) satisfied for those who spoke both.
4.2 Region
As Table 2 shows, the region where participants were living one year before starting postsecondary education23 had more influence on professional status than educational experience. However, we also note that fewer students from Kivalliq (40.9% or 45 out of 110) received money from grants, bursaries, or scholarships than those from Kitikmeot (69.0% or 20 out of 29), Qikiqtaaluk (56.0% or 84 out of 150), or outside Nunavut (66.0% or 35 out of 53). Furthermore, the proportion of students receiving FANS funding was different for students from Nunavut and those from outside, ranging from 78.0% to 87.0% for the former depending on the region (for a total of 173 out of 219), and 48.7% for those from outside (19 out of 39).
TABLE 2. Influence of region of residency prior to start of postsecondary education
|
Kitikmeot |
Kivalliq |
Qikiqtaaluk |
Outside Nunavut |
On grants, bursaries, and scholarships (postsecondary) |
69.0% |
40.9% |
56.0% |
66.0% |
On employment income |
86.2% |
78.4% |
62.7% |
77.8% |
On self-employment income |
0.0% |
6.8% |
13.8% |
26.7% |
On working full time |
64.3% |
80.4% |
58.3% |
74.50% |
Participants from Kitikmeot were more likely to declare employment income (86.2% or 25 out of 29), followed by participants from Kivalliq (78.4% or 87 out of 111), outside Nunavut (77.8% or 42 out of 54), and Qikiqtaaluk (62.7% or 94 out of 150). Self-employment income was more commonly declared outside Nunavut (26.7% or 4 out of 15), followed by Qikiqtaaluk (13.8% or 24 out of 174), Kivalliq (6.8% or 9 out of 132), and Kitikmeot (0% or 0 out of 32).
Even though a clear majority of participants reported having full-time employment (including self-employment), the percentage was higher in Kivalliq (80.4% or 86 out of 107) and outside of Nunavut (74.5% or 35 out of 47) than in Kitikmeot (64.3% or 18 out of 28) or Qikiqtaaluk (58.3% or 84 out of 144).
4.3 Gender
The study population was made up of 239 women (66.2%) and 122 men (33.8%).24 According to the 2011 NHS Aboriginal Population Profile (Statistics Canada, 2013), women represent 46.7% of Nunavut Inuit aged 15 or older with a postsecondary certificate, diploma, or degree. At first glance, there seems to be a discrepancy between the sample’s gender rate and that of Nunavut Inuit with postsecondary experience. However, a large portion of the difference can be explained by the fact that 77.9% of people with apprenticeship and trades certificate are men, a population excluded from our sample. At the time of the survey, there were 1,375 Inuit women (61.7%) and 860 Inuit men (38.6%) with college and university diplomas or certificates. Thus, our sample closely resembles that of the surveyed population.
TABLE 3. Influence of gender
|
Male |
Female |
Received money from parents and family |
11.0% |
19.7% |
Graduated from high school |
69.4% |
77.3% |
Mentioned the impact of housing for families on having better access to postsecondary education |
16.2% |
27.1% |
Job sector before postsecondary education |
Retail (31.8%) Professional (24.7%) Administrative support (21.2%) |
Administrative support (37.8%) Retail (24.5%) Paraprofessional (14.4%) |
With children during postsecondary education |
28.3% |
48.9% |
Impact of having children during postsecondary education |
32.6% with important impact 2.3% said it prevented them from finishing their program |
43.5% with important impact 10.5% said it prevented them from finishing their program |
As Table 3 shows, we can also see gender differences with respect to the money received from parents or family members: 19.7% of women (46 out of 233) received family financial support compared to 11.0% of men (13 out of 118). In terms of academic satisfaction,25 women were also more likely to be strongly satisfied (24.9% or 42 out of 169) than men (15.8% or 12 out of 76).26 Fewer men entered postsecondary education with a high school diploma (69.4% or 75 out of 108) than women (77.3% or 174 out of 225). On the question of how to improve access to postsecondary education, 27.1% of women (57 out of 210) called for improved access to housing for families, compared to 16.2% of men (17 out of 105). As for the kinds of jobs participants had before entering postsecondary education, women primarily held administrative support (37.8% or 71 out of 188), retail (24.5% or 46 out of 188), or paraprofessional positions (14.4% or 27 out of 188), while men mostly held retail (31.8% or 27 out of 85), professional (24.7% or 21 out of 85), or administrative support positions (21.2% or 18 out of 85).
We also found significant differences between men and women concerning parental responsibilities during their studies. Less than half the participants (41.9% or 149 out of 356) reported having to take care of children while pursuing postsecondary education, but of those, 48.9% were women (115 out of 235) compared to 28.3% who were men (34 out of 120). About half (50.9% or 85 out of 167) of those taking care of children said it had had limited or no impact on their postsecondary education (46.0% for women, or 57 out of 124, and 65.1% for men, or 28 out of 43). Another 40.7% (68 out of 167) said it had had a significant impact (43.5% for women, or 54 out of 124, and 32.6% for men, or 14 out of 43) and 8.4% (14 out of 167) said it had prevented them from finishing the program they were undertaking (10.5% for women, or 13 out of 124, and 2.3% for men, or 1 out of 43).27
5. Multidimensional model of educational and professional pathways
Drawing on an exploratory approach, we used multiple correspondence analysis (MCA) to look at the relationships between explanatory variables and the educational and professional pathways of Nunavut postsecondary students, using the inflated data set (n = 9,412), that is, the original data set (n = 362) plus 25 imputed data sets using the fully conditional specification method (FCS) (van Buuren, 2007). The objective of our model was to study the associations between variables. The MCA model was built on the six variables described earlier (language, home region in Nunavut, gender, parents’ educational attainment, satisfaction at work, and appreciation of the postsecondary experience) and explains 51.2% of the total inertia (the amount of variation), as we can see in Table 4.
TABLE 4. Model summary
|
Variance Accounted For |
|
|
Total (Eigenvalue) |
Inertia |
Dimension 1 |
1.757 |
0.293 |
Dimension 2 |
1.316 |
0.219 |
Total |
3.073 |
0.512 |
Mean |
1.536 |
0.256 |
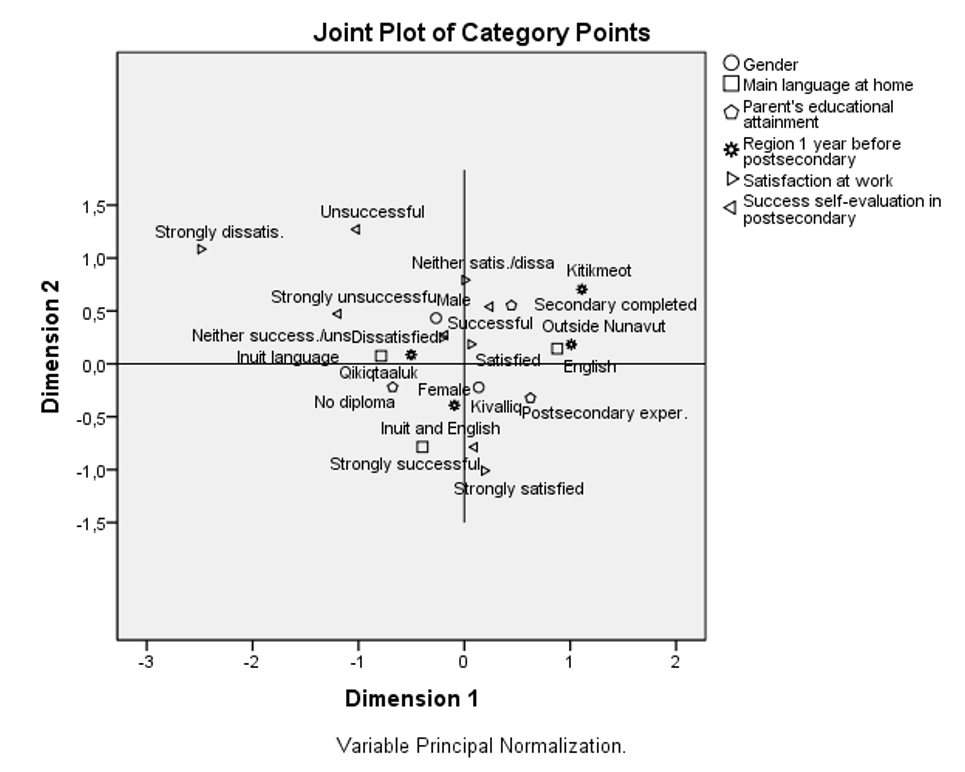
The MCA factor plot shows some relationships between variable categories. Variable categories are positively linked when they are close on the plot. Conversely, negatively correlated variable categories are positioned on opposed quadrants. If we look at the “big picture” for our model, we can see, for example, that the quadrant at the lower right groups women who considered their postsecondary experience was strongly successful, who were strongly satisfied at work, who had parents with postsecondary experience, and who were in Kivalliq one year before accessing postsecondary.
FIGURE
1. Multidimensional model illustration
As shown on Figure 1, the MCA factor plot reveals that the language spoken at home is an important determinant of job satisfaction. Participants who mainly spoke English at home were more likely to have parents with postsecondary experience and to come from Kitikmeot or outside Nunavut. Participants who mainly spoke an Inuit language at home were more likely to have parents without a diploma, to come from Qikiqtaaluk, and to be strongly dissatisfied with their jobs.
We also see strong links between satisfaction at work and appreciation of the postsecondary experience. For example, participants who felt that their postsecondary experience was strongly successful were more likely to be strongly satisfied at work. In contrast, participants who felt that their postsecondary experience had been unsuccessful were more likely to be strongly unsatisfied at work. The same relationship can be seen for those who felt their postsecondary experience had been strongly unsuccessful (and who were more likely to be strongly unsatisfied at work).
Some links could not be established because of the quality of the representation of certain variable categories on the plot. This happens when variable categories are near the origin and is due to the size of our sample (n = 362), even though it represents about 16.2% of the population. Consequently, we must remain vigilant about possible type II errors (where we conclude there is no link between two categories, but there is effectively a link for the population).
For our part, we prefer to remain cautious and not mention in the MCA the possible relationships that we observe on the graphic but cannot be verified. This is why all the associations previously described between categories were evaluated formally using chi-squared statistics on the enhanced dataset. However, given the need to use multiple imputation, this statistic is approximately 26 times higher than the one that could be observed on the original dataset if there were no missing data. For this reason, chi-squared values should be divided by 26, and p values revaluated. For variables with a significant association, the standardized residuals were computed for each cell of the contingency table, as suggested by Agresti (2013).28
6. Discussion
Our results clearly show that Nunavut Inuit who go on to postsecondary education are largely satisfied with their experience and current job situation. These results are consistent with general trends for Canadian postsecondary graduates, who experience better conditions in the job market than those without a postsecondary education, independent of their field of studies (Frenette, 2019). Furthermore, we know that the vast majority of Canadian undergraduate students are satisfied or very satisfied with their experience at university (Canadian University Survey Consortium, 2011). We can also link those results to the positive impacts of postsecondary education on Indigenous Canadians in terms of employment and income (Hull, 2005). Denkenberger et al. (2015) have also highlighted the positive economic impact of postsecondary education for graduates in Northern communities.
Even if access to postsecondary education in Canada has significantly improved over the last several decades, there are still regional differences — not only between the Northern and Southern regions, but also between provinces (Finnie et al., 2015). Some groups are also much more likely to be excluded from colleges and universities due to their socioeconomic background (Kamanzi et al., 2010) or culture (Robson et al., 2018), as is still very much the case for Indigenous Peoples (Statistics Canada, 2013). Participants in our study who spoke an Inuit language or both English and an Inuit language at home were generally satisfied with their postsecondary and professional experiences, even though their overall satisfaction was less positive than those who spoke mainly English at home. Another strong association is observed between language and the region where participants were living one year before entering postsecondary education. There were numerous similarities between participants from Kitikmeot and outside Nunavut, and between those from Qikiqtaaluk and Kivalliq: English is more important in the first two regions and Inuit languages in the last two. These findings are consistent with the concept of systemic discrimination in the Nunavut education system developed by Skutnabb-Kangas et al. (2019) in that they show better postsecondary outcomes for students who speak English at home.
This situation also has consequences for the labour market, since those who do better at work are those who speak English at home and, for that reason, have had better access to postsecondary education. As Berger (2009), Tester and Kulchyski (1994), and Van Meenen (1994) have noted, the school system was developed as an instrument of colonial policy to move Inuit into settlements and to prepare them for the wage economy. We can agree with Berger that Eurocentrism might still be a major issue in the Nunavut school system, reducing the academic success of Inuit-speaking students. This is also the case more generally in the Canadian North, as O’Gorman and Pandey (2015) have observed. Their statistical analysis of school success in Northern communities indicated that being taught in an Aboriginal language reduces the probability of graduating from high school. In comparison, Finnie et al. (2015) showed that there are generally no significant differences between official language minorities (French outside Quebec and English in Quebec) regarding access to postsecondary education, with the exception of Quebec Anglophones, who are more likely to have access than other Quebecers.
Even though participants in our survey were generally satisfied with their postsecondary experience and job situation, the level of satisfaction was higher for women than men. More specifically, we found that men were largely overrepresented among the relatively small number of participants who expressed dissatisfaction on these variables. These results are not surprising considering the gender gap in favor of women in postsecondary access and achievement is well documented in developed countries (OECD, 2020) and in Canada (Frenette & Zeman, 2008), and considering that Canadian women are more likely to earn a college or university diploma than men, but less likely to obtain a trades certificate (Ferguson, 2016). Among the Inuit population, Kleinfeld and Andrews (2006) have also pointed to a “male malaise” among Alaskan Aboriginal students leading to greater disengagement from postsecondary education.
Most participants in our survey were first-generation postsecondary students, since few of their parents had any postsecondary experience. This means that the majority of Nunavut postsecondary students do not fit into the “heirs” model (Bourdieu & Passeron, 1964). Those who do, however, generally have a more positive postsecondary experience. We can also link our results to Salokangas and Parlee (2009), who noted the influence of family social position on educational outcomes for Inuit youth in Tuktoyaktuk (Northwest Territories):
If a family is strongly anchored in the political, traditional, and wage economies, it will envision more schooling and lucrative options for its young people and encourage them to seek higher education in order to come back and find wage employment. If a family struggles to be self-sufficient, it will see formal education as a means to ‘get out of the community’ or to become better able to fight for the scarce jobs. (p. 202)
Finally, we know from Kamanzi et al. (2010) that first-generation students in Canada have a lesser chance of accessing higher education, but an equal chance of completing their studies once admitted. This means that the major challenge for first-generation students across the country is getting into higher education in the first place. In Nunavut more specifically, this challenge is most closely associated with language and with the geographic mobility required to pursue postsecondary education in the South. Only one third of our survey participants reported having enough money to adequately live on during their postsecondary studies. Financial support remains a crucial factor for all Indigenous students in Canada, and we also know that community allocations for First Nations postsecondary students are insufficient for their needs (Rodon, 2008; Paquette & Fallon, 2010).
Conclusion
Our study is a source of much good news considering that the postsecondary experience of study participants was mostly positive. There is a clear relationship between postsecondary experience and job satisfaction, and most of the participants reported being back in their home communities or said they wanted to be. This is very encouraging. Contrary to the trend in Southern Canada, where most non-Indigenous students tend to move to major centres (e.g., Deschenaux et al., 2007) after completing postsecondary education, our findings strongly suggest that investment in postsecondary education will directly benefit Inuit communities and Nunavut as a whole.
However, there are also some very disquieting trends. For example, it is clear that the education system in Nunavut is geared towards English-speaking learners, and that Inuit language speakers, even those who are bilingual, do not succeed as well as people who mainly speak English at home. This is a matter of systemic language discrimination that should be addressed in order to strengthen the Inuit language in Nunavut. At present, success is clearly linked to the ability to speak English.
The other worrisome trend is that the women who participated in our study — despite being more likely to succeed academically, to want to further their education, and to be employed full time — tended to have lower professional attainment in terms of position and income. This situation is not specific to Nunavut and is consistent with similar trends in the rest of Canada (Moyser, 2017). But given that women make up the majority of postsecondary graduates, it is clearly a form of systemic discrimination that should be addressed not only for reasons of equity, but also to ensure that educated Inuit women are employed to their full potential.
Acknowledgements
The authors want to thank all the Nunavummiut that accepted to participate in this project and answered the survey. In addition, we are grateful to Gaétan Daigle (MSc, PStat), statistician at Université Laval, for his help in understanding the multiple correspondence analysis method and its application to our database. His review of the methodological sections of our draft was essential to the quality of this paper. This project was funded by the Nunavut General Monitoring Plan.
Notes
According to Statistics Canada, postsecondary education includes “Apprenticeship or trades certificate or diploma,” but it was not retained in our sample in accordance with our research objectives. Our sample includes “College, CEGEP or other non-university certificate or diploma,” “University certificate or diploma below bachelor level,” and “University certificate, diploma or degree at bachelor level or above.”
In the Canadian context, our sample includes both college and university certificates and diplomas. Canadian universities offer degrees (e.g., BA, MSc, or PhD) and non-degree certificates, while colleges offer different kinds of diplomas according to the province or territory (Usher, 2018, pp. 6–7). Colleges in Saskatchewan, Manitoba, Ontario, and the Atlantic provinces mostly deliver vocational or trades programs to mature students. In Alberta and British Columbia, colleges offer these same kinds of programs as well as transfer programs allowing students to pursue the first two years of a university degree. In Quebec, colleges offer general programs (2 years) that are usually required to pursue university degrees as well as vocational and professional programs (3 years).
Systemic discrimination has been defined by the Supreme Court of Canada as “practices or attitudes that have, whether by design or impact, the effect of limiting an individual’s or a group’s right to the opportunities generally available because of attributed rather than actual characteristics” [Canadian National Railway Co. v. Canada (Canadian Human Rights Commission), [1987] 1 S.C.R. 1114 at p. 1138].
The total number of participants may vary for each variable due to missing cases specific to each of the variables.
Nunavut Sivuniksavut is a two-year postsecondary program for Inuit students from Nunavut located in Ottawa. The first year is accredited by Algonquin College and the second year by Carleton University.
These two last variables must not be confused with the indicators that we used for the bivariate analysis (academic satisfaction and job satisfaction, as mentioned in Section 4). For the multidimensional part of the analysis, we referred to a single question for each indicator, as we wanted to look at the links between categories from all variables. For satisfaction at work, the question was “Are you generally satisfied in your current work?” For appreciation of the postsecondary experience, the question was “Would you consider that postsecondary education was a successful experience for you?”
More precisely, 25 imputed datasets were created from the original data, as well as the original data itself, for a potential of n = 26 × 362 = 9,412 observations. The use of 25 imputed data sets is recommended by Enders (2010) in order to have good statistical data representation.
These data from NHS are related to the Inuit who did complete a certificate or diploma. They do not include all Inuit with postsecondary experience, as is the case for those who did not complete a certificate or diploma.
The NHS refers to the Baffin region (census division) instead of Qikiqtaaluk and the Keewatin region (census division) instead of Kivalliq.
There are also 11.9% who studied outside Nunavut and 15.1% who went to high school in more than one community (including outside Nunavut).
Excluding having to take care of children, which is another category of answer.
Academic satisfaction was determined by an indicator built out of five survey questions asking if postsecondary education had been a successful experience, had been a worthwhile investment, had met expectations, and had qualified the participant for a job, and also if participants felt qualified for their current positions.
“Kakivak Association is a community and economic development organization serving Inuit, by providing business, employment and training services to enhance the strengths of communities in the Qikiqtani region. Our board and staff are committed to working with communities, individuals, organizations and employers to help Inuit realize their goals and aspirations” (Kakivak Association, n.d.).
For example, many Inuit who have graduated from the Nunavut Teacher Education Program are no longer teachers and are instead working for the Nunavut government or for Inuit organizations.
The NHS data includes Inuit aged 15–18, many of whom are not in the labour force because they have yet to begin working and are living in households where someone else is. Therefore, although the number of Inuit not in the labour force is significantly higher in the NHS than it is in the current survey, data should be interpreted carefully.
The number of executives also almost doubles (from 2.6% to 4.3%), but it is difficult to assert with certainty if this highlights a tendency or if it is just symptomatic of the small number of executives in the sample.
Job satisfaction is determined by an indicator built out of three questions concerning participants’ satisfaction with their current work, income, and job description.
The statistical significance threshold of 0.05 is generally used as a standard. It means there is a 5% chance that we conclude to a difference between observed results and null hypothesis when there is actually no difference.
There is also 1 participant (out of 360) who answered using mainly French at home. Due to that small number, we decided not to include that category in the data presentation.
The region was determined with a question asking where the participants were living 12 months before entering postsecondary education.
Significant at 0.066 according to the Pearson chi-squared test.
Data concerning parents’ education reflects the highest educational attainment reached by either the mother or the father.
When crossing data with region, we used this definition since it reflects where participants were living just before entering postsecondary education. We did not use region of birth or region of residency during high school, as participants could possibly have moved elsewhere prior to entering postsecondary education.
Data are missing for 1 case.
Academic satisfaction was determined by an indicator built out of five survey questions asking if postsecondary education had been a successful experience, had been a worthwhile investment, had met expectations, and had qualified the participants for a job, and also if participants felt qualified for the position they held.
Inversely, we also noted that men were slightly more likely (78.9% or 60 out of 76) than women (75.1% or 127 out of 169) to be satisfied (but not strongly).
Significant at 0.097 according to the Pearson chi-squared test.
Residuals that exceed 2 in absolute value indicate a deviation from the null hypothesis of no association. Again, those residuals were overestimated by a factor of about √26 since we were using the enhanced dataset. Thus, we should examine only residuals which are higher than 10.2 (or √26 × 2).
References
Agresti, A. (2013). Categorical data analysis (3rd ed.). John Wiley & Sons, Inc.
Benzécri J.-P., Bellier, L., & Bellier, L. (1973). L’analyse des données. Éditions Dunod.
Berger, P. (2009). Eurocentric roadblocks to school change in Nunavut. Études/Inuit/Studies, 33(1–2), 55–76. https://doi.org/10.7202/044960ar
Black, K. (2015). Extracting Northern knowledge: Tracing the history of post-secondary education in the Northwest Territories and Nunavut. The Northern Review, 40, 35–61. https://thenorthernreview.ca/index.php/nr/article/view/462
Bourdieu, P., & Passeron, J.-C. (1964). Les héritiers : Les étudiants et la culture. Éditions de Minuit.
Canadian University Survey Consortium. (2011). 2011 undergraduate university student survey: Master report. http://www.cusc-ccreu.ca/publications/CUSC_2011_UG_MasterReport.pdf
Denkenberger, D., Way, J., & Pearce, J. M. (2015). Educational pathways to remote employment in isolated communities. Journal of Human Security, 11(1), 34–44. https://doi.org/10.12924/johs2015.11010034
Deschenaux, F., Aspiros, G., Bélanger, G., & Lapratte, B. (2007). L'insertion professionnelle et la mobilité géographique des néodiplômés et des étudiants universitaires en région. Fédération étudiante universitaire du Québec & Observatoire Jeunes et Société. https://www.capres.ca/wp-content/uploads/2014/07/PUBIF-2007-1-CASP-Laplatte-rech-0607-insertionmobiliteregion-fr.pdf
Enders, C. K. (2010). Applied missing data analysis. Guilford Press.
Ferguson, S. J. (2016). Women and education: Qualifications, skills and technology. Statistics Canada. https://www150.statcan.gc.ca/n1/pub/89-503-x/2015001/article/14640-eng.htm
Finnie, R., Mueller, R. E., & Wismer, A. (2015). Access and barriers to postsecondary education: Evidence from the Youth in Transition Survey. Canadian Journal of Higher Education, 45(2), 229–262. https://doi.org/10.47678/cjhe.v45i2.2472
Frenette, M. (2019). Are the career prospects of postsecondary graduates improving? Statistics Canada. https://www150.statcan.gc.ca/n1/pub/11f0019m/11f0019m2019003-eng.htm
Frenette, M., & Zeman, K. (2008). Understanding the gender gap in university attendance: Evidence based on academic performance, study habits, and parental influences. In R. Finnie, R. E. Mueller, A. Sweetman, & A. Usher (Eds.), Who goes? Who stays? What matters? Accessing and persisting in post-secondary education in Canada (pp. 135–152). McGill-Queen’s University Press.
Gaviria, O. P. (2013). Inuit self-determination and postsecondary education: The case of Nunavut and Greenland [Doctoral thesis, University of Toronto]. TSpace. http://hdl.handle.net/1807/65562
Government of Nunavut. (2020). Public service annual report 2018–19. https://gov.nu.ca/sites/default/files/psar_2018-19_-_final_21-01-2020.pdf
Graham, A. (2015). The university project in the Canadian North, 1964 to 2014. Historical Studies in Education / Revue d’histoire de l’éducation, 27(1), 80–98. https://doi.org/10.32316/hse/rhe.v27i1.4426
Hull, J. (2005). Post-secondary education and labour market outcomes Canada, 2001. Prologica Research Inc.
Kakivak Association. (n.d.). Kakivak Association. http://www.kakivak.ca
Kamanzi, P. C., Doray, P., Bonin, S., Groleau, A., & Murdoch, J. (2010). Les étudiants de première génération dans les universités : L’accès et la persévérance aux études au Canada. Canadian Journal of Higher Education / Revue canadienne d’enseignement supérieur, 40(3), 1–24. https://journals.sfu.ca/cjhe/index.php/cjhe/article/view/2012
Kleinfeld, J., & Andrews, J. J. (2006). Postsecondary education gender disparities among Inuit in Alaska: A symptom of male malaise? Études/Inuit/Studies, 30(1), 111–121. https://doi.org/10.7202/016152ar
Le Roux, B., & Rouanet, H. (2010). Multiple correspondence analysis. SAGE Publications.
McGregor, H. E. (2010). Inuit education and schools in the Eastern Arctic. University of British Columbia Press.
Moyser, M. (2017). Women and paid work. Statistics Canada. https://www150.statcan.gc.ca/n1/pub/89-503-x/2015001/article/14694-eng.htm
Murray, N. (2019, April 9). As Nunavut turns 20, where is it on Inuit hiring goals? CBC News. https://www.cbc.ca/news/canada/north/article-23-nunavut-inuit-employment-1.5084889
O’Gorman, M., & Pandey, M. (2015). Explaining low high school attainment in Northern Aboriginal communities: An analysis of the Aboriginal Peoples’ Surveys. Canadian Public Policy / Analyse de politiques, 41(4), 297–308. https://doi.org/10.3138/cpp.2015-002
Organisation for Economic Cooperation and Development. (2020). Education at a glance 2015: OECD indicators. OECD Publishing. https://doi.org/10.1787/19991487
Paquette, J., & Fallon, G. (2010). First Nations education policy in Canada: Progress or gridlock? University of Toronto Press.
Robson, K., Anisef, P., Brown, R. S., & George, R. (2018). Underrepresented students and the transition to post-secondary education: Comparing two Toronto cohorts. Canadian Journal of Higher Education / Revue canadienne d’enseignement supérieur, 48(1), 39–59. https://journals.sfu.ca/cjhe/index.php/cjhe/article/view/187972
Rodon, T. (2008). Les étudiants autochtones à l'Université Laval : Enquête sur les besoins et les problématiques. Les Cahiers du CIÉRA, 1, 13–37. https://www.ciera.ulaval.ca/cahier/276
Rodon, T., Lévesque, F., & Kennedy Dalseg, S. (2015). Qallunaaliaqtut: Inuit students’ experiences of postsecondary education in the South. McGill Journal of Education / La Revue des sciences de l'éducation de McGill, 50(1), 97–118. https://mje.mcgill.ca/article/view/9052
Rodon, T., Lévesque, F., Walton, F., O’Leary, D., & Wheatley, K. (2018a). Chapter 9: Education. In T. Bell, & T. M. Brown (Eds.), From science to policy in the Eastern Canadian Arctic: An Integrated Regional Impact Study (IRIS) of climate change and modernization (pp. 251–267). ArcticNet.
Rodon, T., Lévesque, F., Walton, F., Kennedy Dalseg, S., Gross, P., & Anerak Okalik, M. (2018b). Chapter 23: Postsecondary education: Understanding Inuit students’ experiences and their educational and professional success. In T. Bell, & T. M. Brown (Eds.), From science to policy in the Eastern Canadian Artic: An Integrated Regional Impact Study (IRIS) of climate change and modernization (pp. 549–559). ArcticNet.
Salokangas, R., & Parlee, B. (2009). The influence of family history on learning opportunities of Inuvialuit youth. Études/Inuit/Studies, 33(1–2), 191–207. https://doi.org/10.7202/044967ar
Skutnabb-Kangas, T., Phillipson, R., & Dunbar, R. (2019). Is Nunavut education criminally inadequate? An analysis of current policies for Inuktut and English in education, international and national law, linguistic and cultural genocide and crimes against humanity. Nunavut Tunngavik Incorporated. https://www.tunngavik.com/files/2019/04/NuLinguicideReportFINAL.pdf
Statistics Canada. (2013). NHS Aboriginal population profile, 2011. https://www12.statcan.gc.ca/nhs-enm/2011/dp-pd/aprof/index.cfm?Lang=E
Tester, F. J., & Kulchyski, P. (1994). Tammarniit (mistakes): Inuit relocation in the Eastern Arctic 1939-63. University of British Columbia Press.
Usher, A. (2018). The state of post-secondary education in Canada, 2018. Higher Education Strategy Associates. http://higheredstrategy.com/wp-content/uploads/2018/08/HESA_SPEC_2018.pdf
van Buuren, S. (2007). Multiple imputation of discrete and continuous data by fully conditional specification. Statistical Methods in Medical Research, 16(3), 219–242. https://doi.org/10.1177/0962280206074463
Van Meenen, M. A. (1994). Government policies on education for the native peoples of Siberia and the Canadian Northwest Territories 1900-1990: A historical examination [Doctoral thesis, Dalhousie University]. DalSpace. http://hdl.handle.net/10222/55460
Xu, J., & Wu, H. (2013). Self-regulation of homework behavior: Homework management at the secondary school level. The Journal of Educational Research, 106(1), 1–13. https://doi.org/10.1080/00220671.2012.658457